Introduction
Pathview is an R/Bioconductor package that maps, integrates and renders a wide variety of biological data on relevant pathway graphs. Users just need to supply their gene or compound data and specify the target pathway. Pathview automatically downloads the pathway graph data, parses the data file, maps user data to the pathway, and renders pathway graph with the mapped data. Please check the example analyses and the input/output section below for examples and more details. You may always go through the package vignette for a tutorial.
Pathview Web server extends the core functions of Pathview with: -a simple intuitive graphical user interface -fast and programmatic access through RESTful API -complete pathway analysis workflow supporting multiple omics data and integrated analysis (check: Example 4) -interactive and hyperlinked results graphs for better data interpretation -most complete and up-to-date pathway data via regular database synchronization -open access to all analyses and resources -analysis history and data sharing via free registered user accounts -complete online help and documentation -multiple quick-start example analyses
Input
The web form in the analysis page collects all user inputs. The most important user inputs and the only options with no default are the user data to be visualized or analyzed. There are two major categories of input data: 1) gene data cover any data that map to unique gene IDs including genes, transcripts, genomic loci, proteins, enzymes and their attributes, 2) compound data cover any data that map to unique compound IDs including compounds, metabolites, drugs, small molecules and their attributes. Such generic definitions of gene and compound data allow Pathview to work with a wide range of data types. All user options are self-explanatory and fully described online with examples.
Output
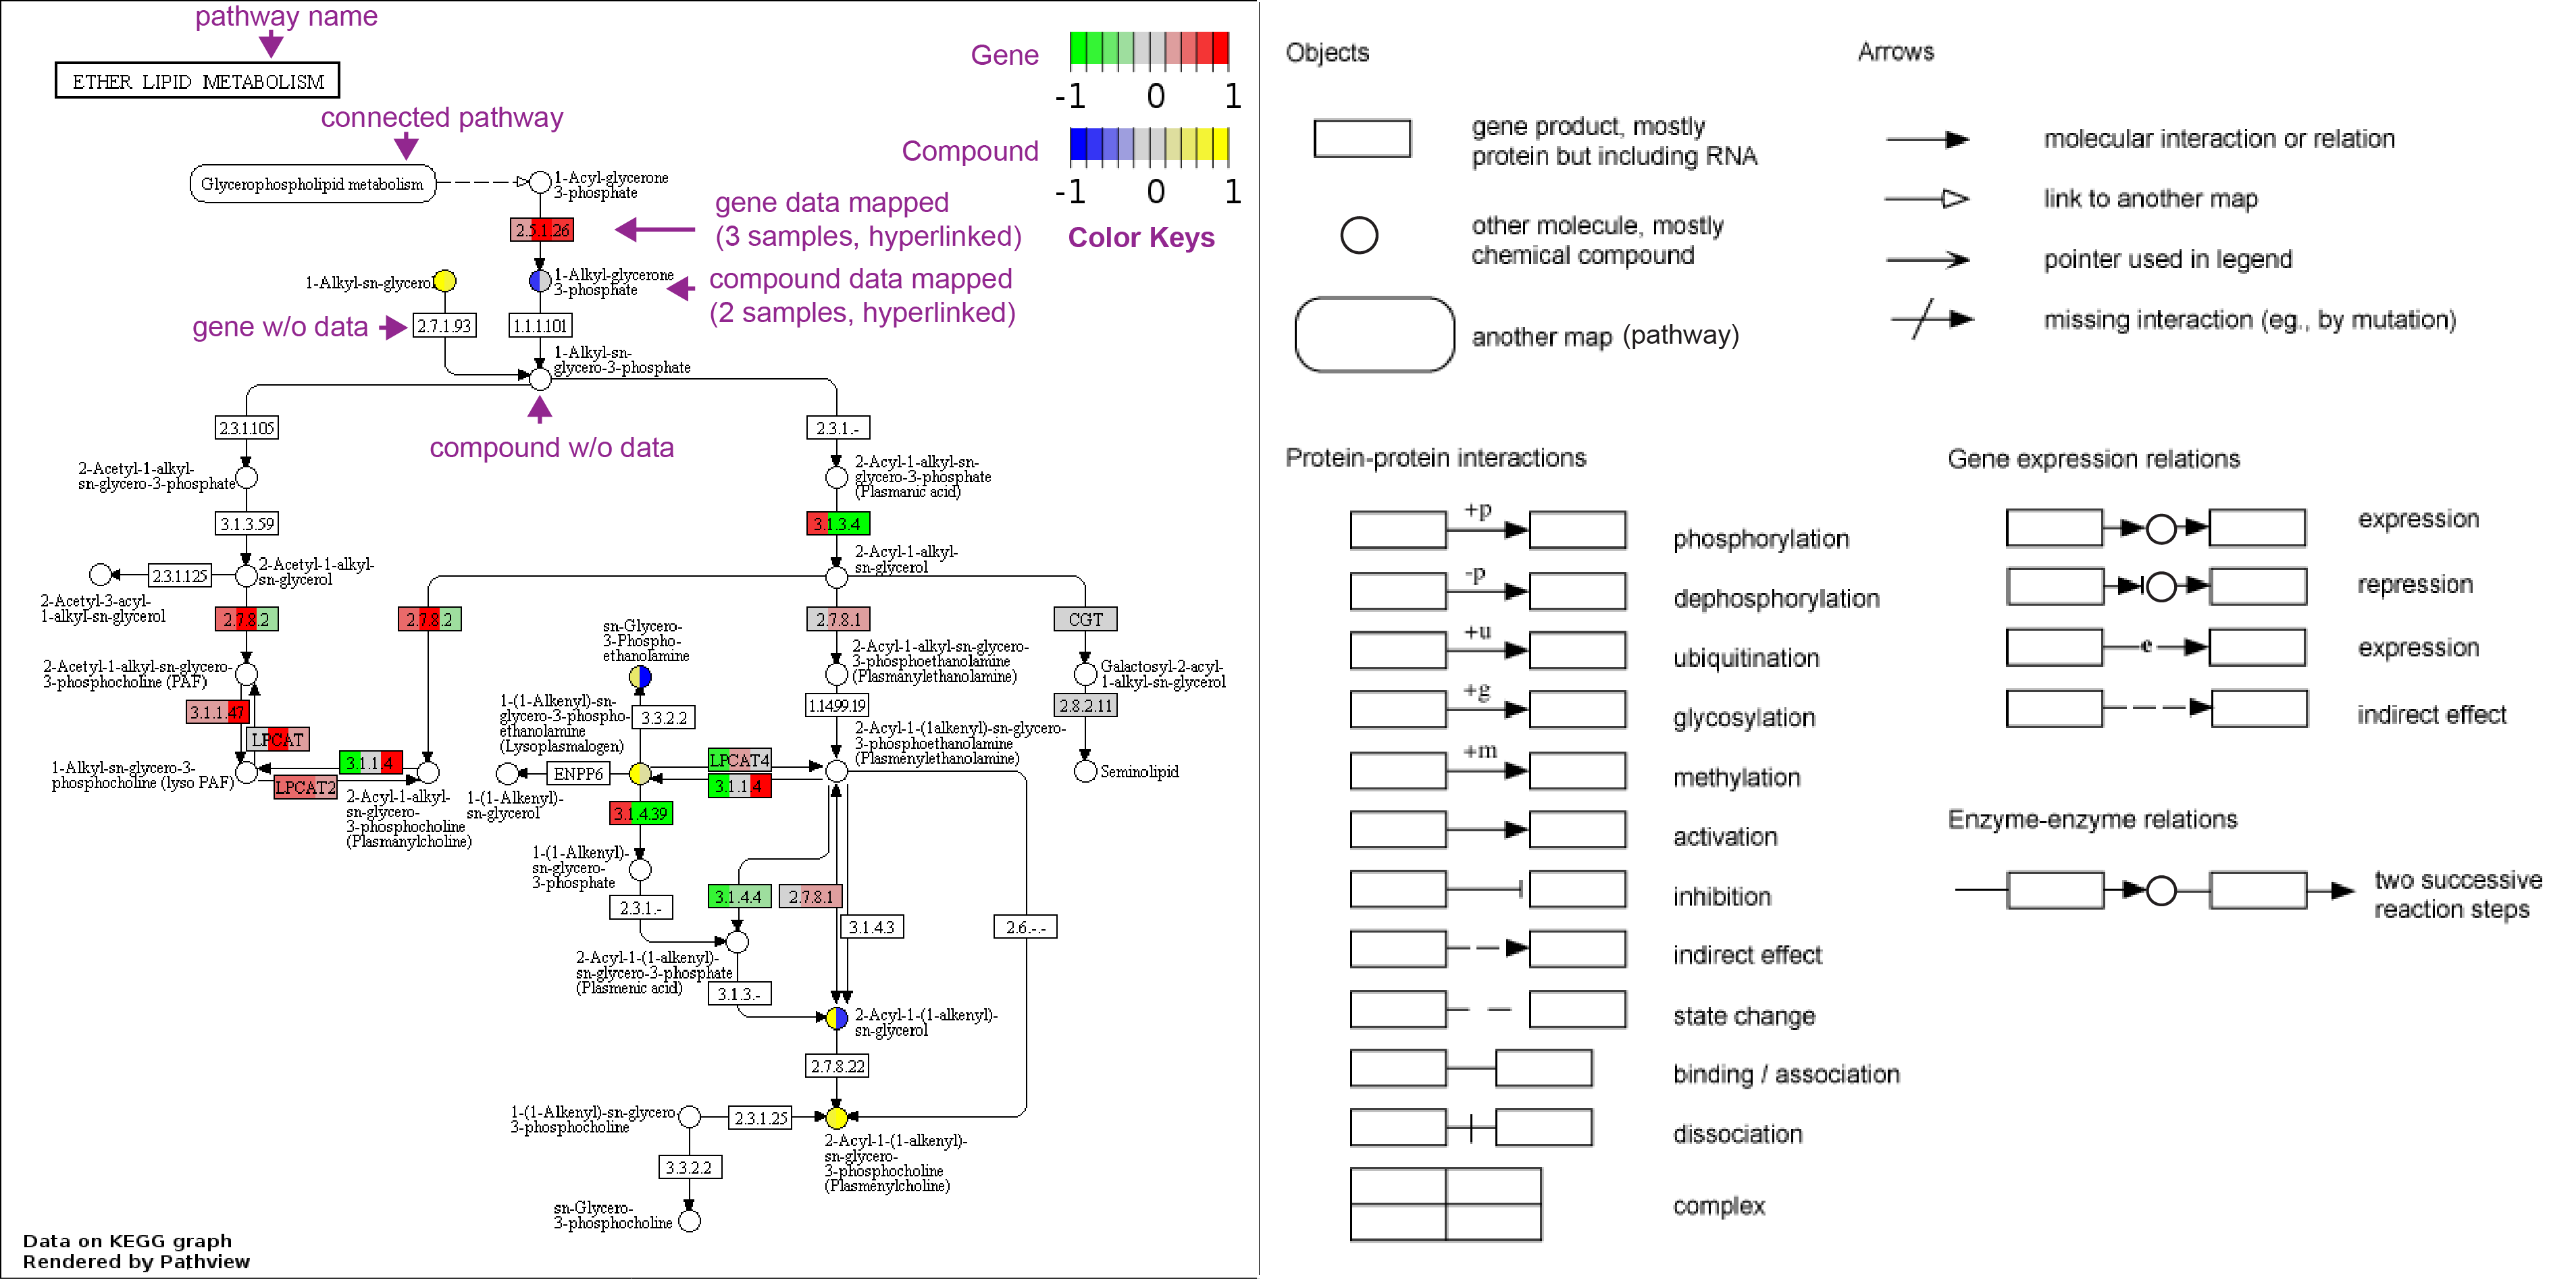
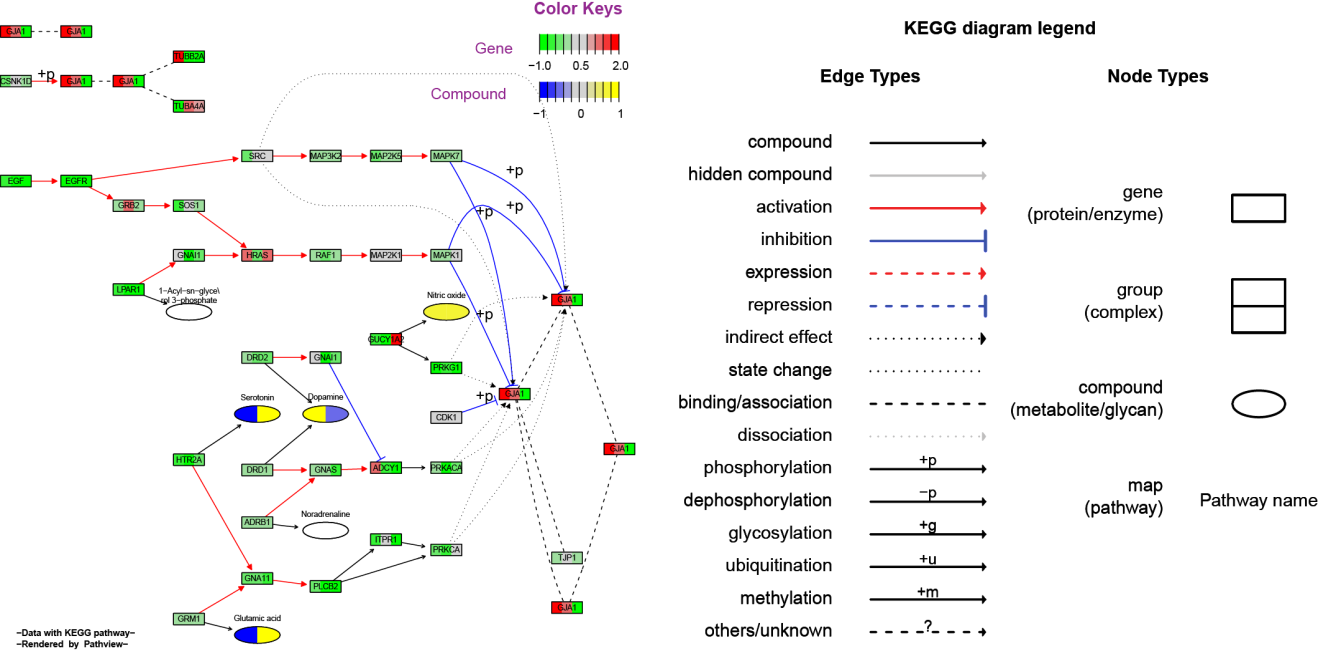
The main results/outputs are pathway graphs with user data integrated (example figures below). Pathview generates graphs in two styles: either the native KEGG view or the Graphviz view. The former renders user data on native KEGG pathway graphs (raster images), and is more interpretable with abundant context and meta-data. The latter layouts pathway graph using Graphviz engine (vector images), and provides better control over node/edge attributes and graph topology. In browser, native KEGG graphs are interactive with hover and hyperlinked annotations.
1) KEGG view (PNG files, as in Example 1)
Raw pathway graph and pathway data
*Legend and annotations added for demonstration.
2) Graphviz view (PDF files, as in Example 2)
Raw pathway graph and pathway data
*Legend and annotations added for demonstration.
3) Pathway analysis results (as in Example 4)
When automatic pathway selection is chosen, pathway analysis will be done before data visualization on selected pathways (
Help
We also provide a comprehensive help system with the server. The help system has four components: 1) a centralized help pages, including documentation of all user options, input and output description; 2) multiple example analyses with input data preloaded and options preset, plus dedicated tutorials; and 3) the help button next to each user option in the analysis pages, which directly links to its help page; 4) extra user support channels through email and the question page.
Reference
Please cite our paper if you use this website. This will help the Pathview project in return.
Please also cite GAGE paper if you are doing pathway analysis besides visualization, i.e. Pathway Selection set to Auto on the New Analysis page.
Contact
Email us: pathomics@gmail.com