Help Information
Custom Analysis

Input & Output

Analysis
Example Analysis
GAGE Example 1
GAGE Example 2
GAGE Example 3
Analysis Output Description
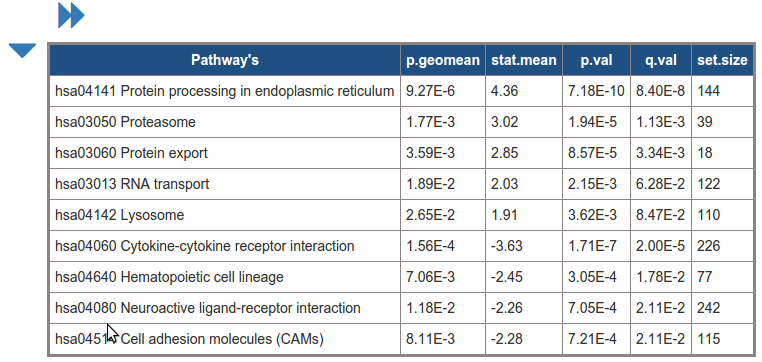
Top List of Significant pathway id's
List of significant pathway id's of the analysis
Column names: Pathway ID, p.geomean, stat.mean, p.val, q.val, set.size, experiments list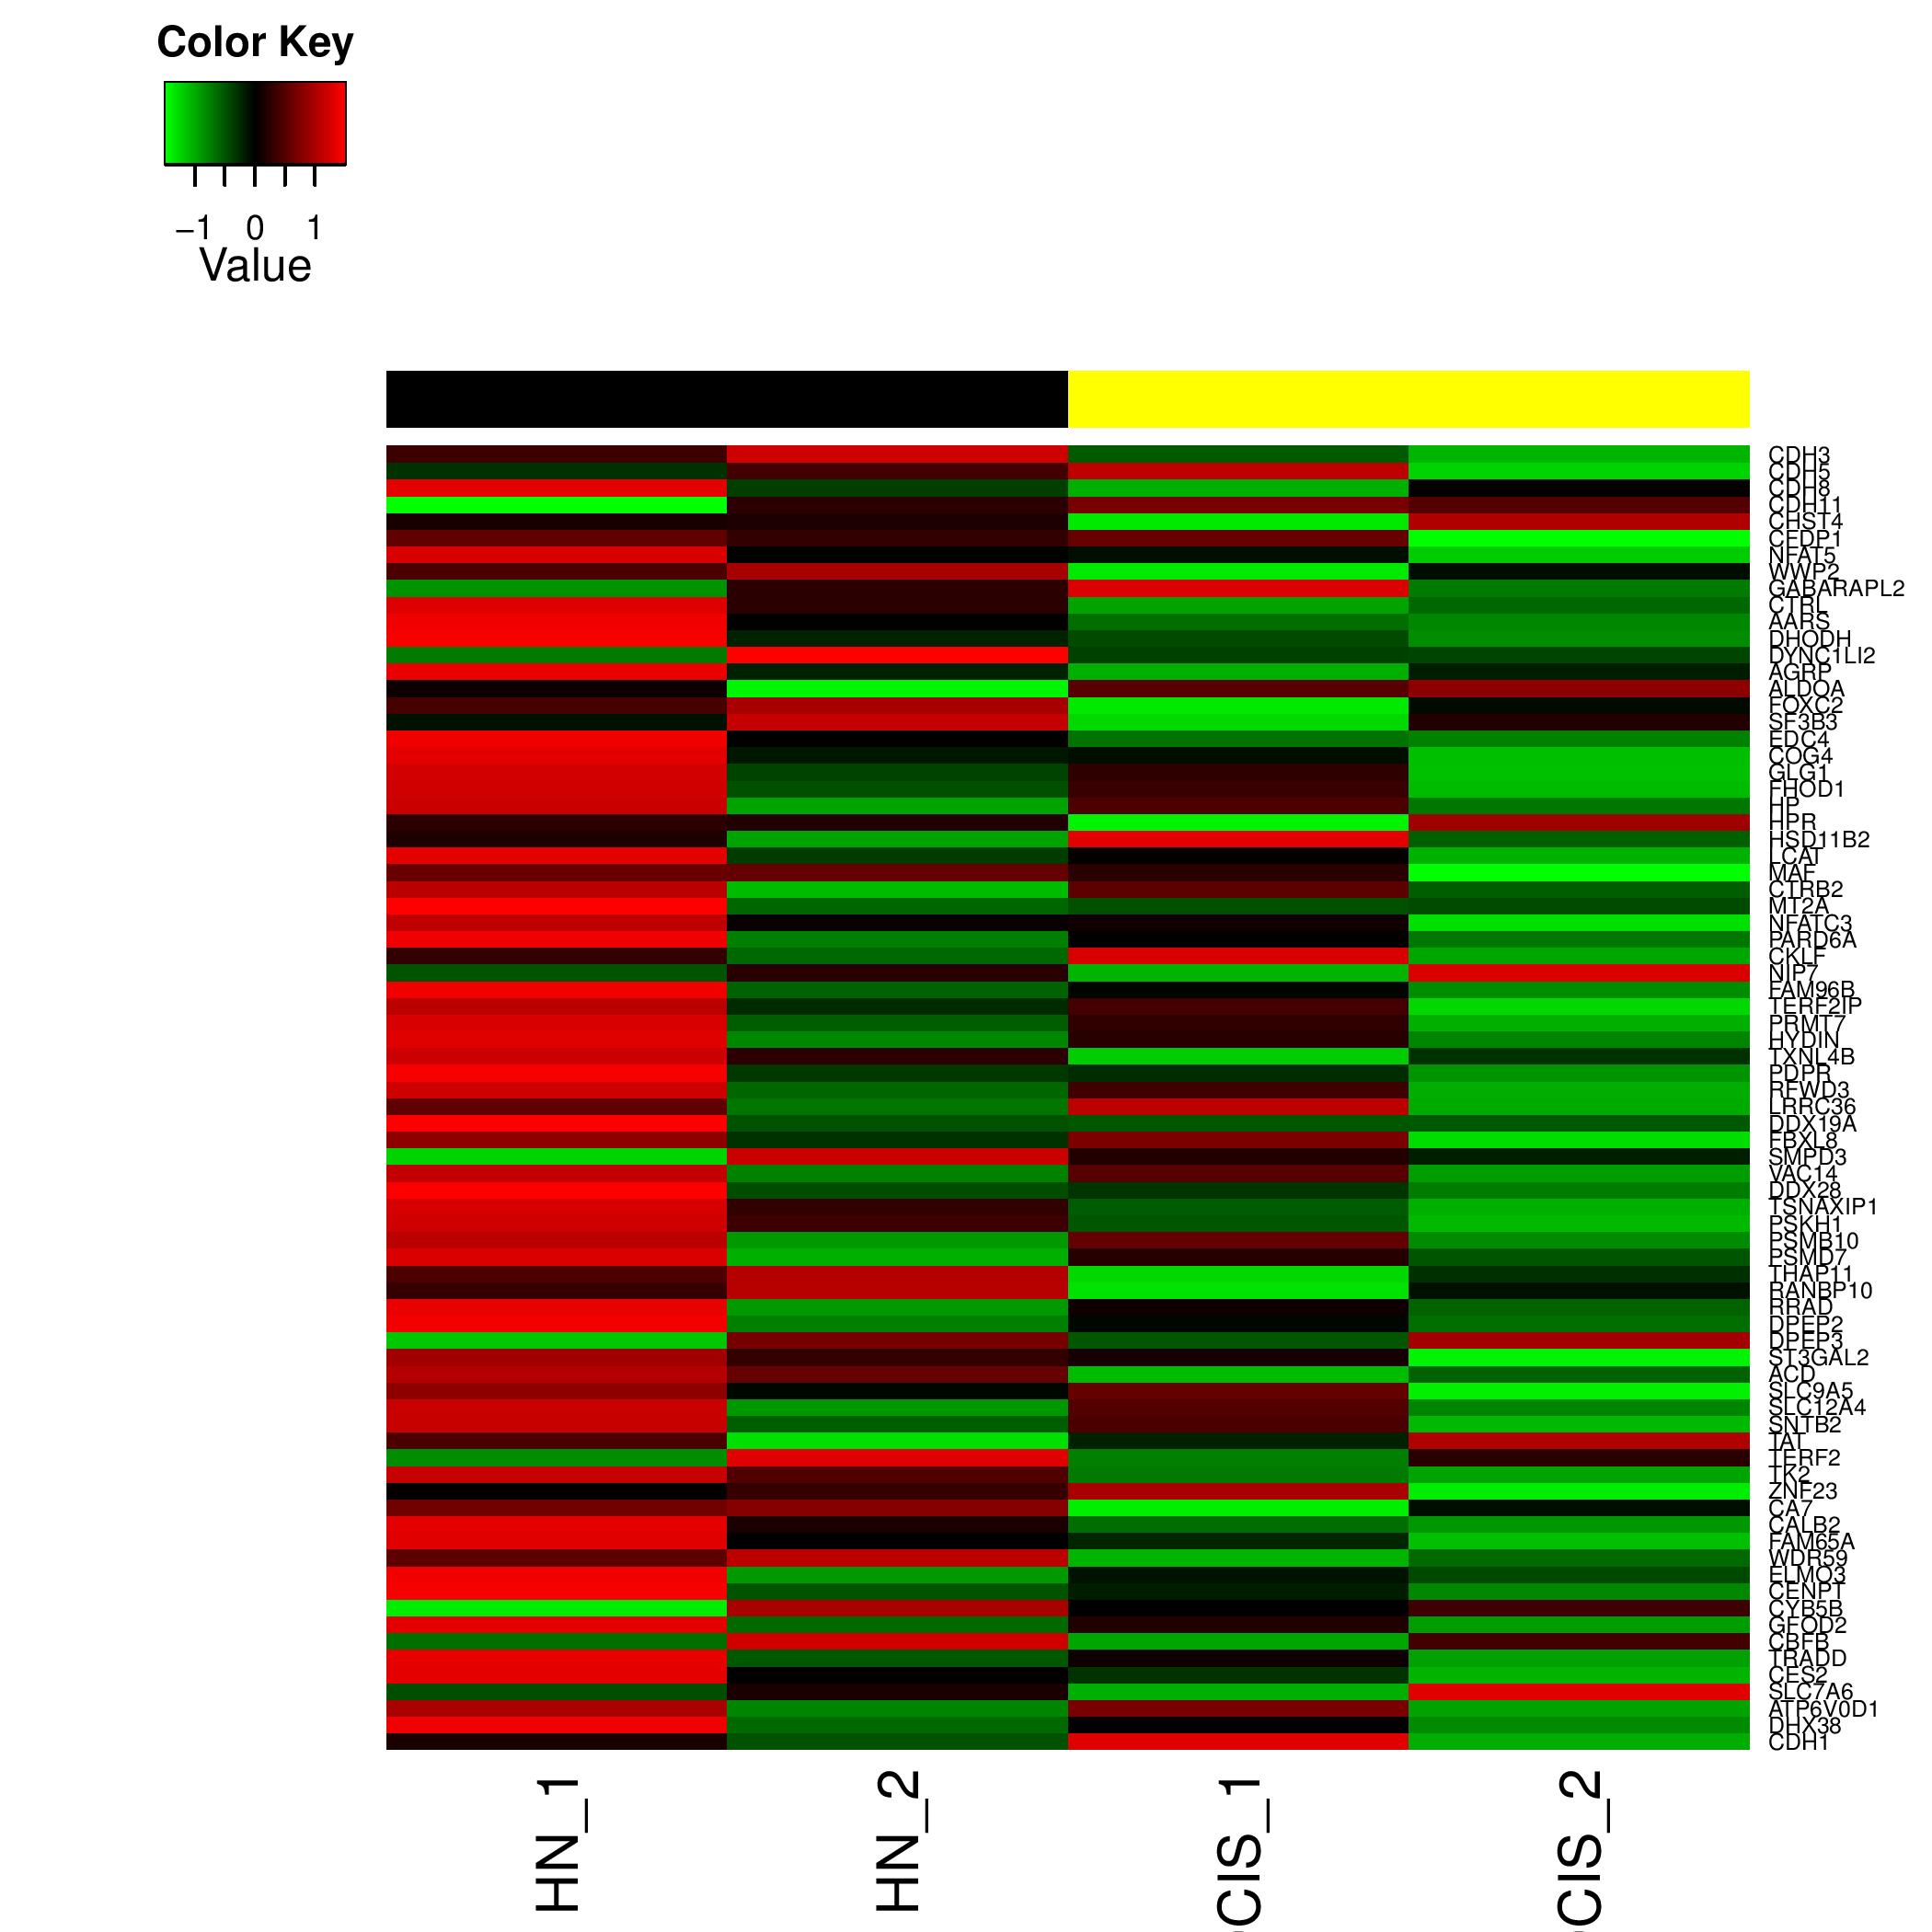
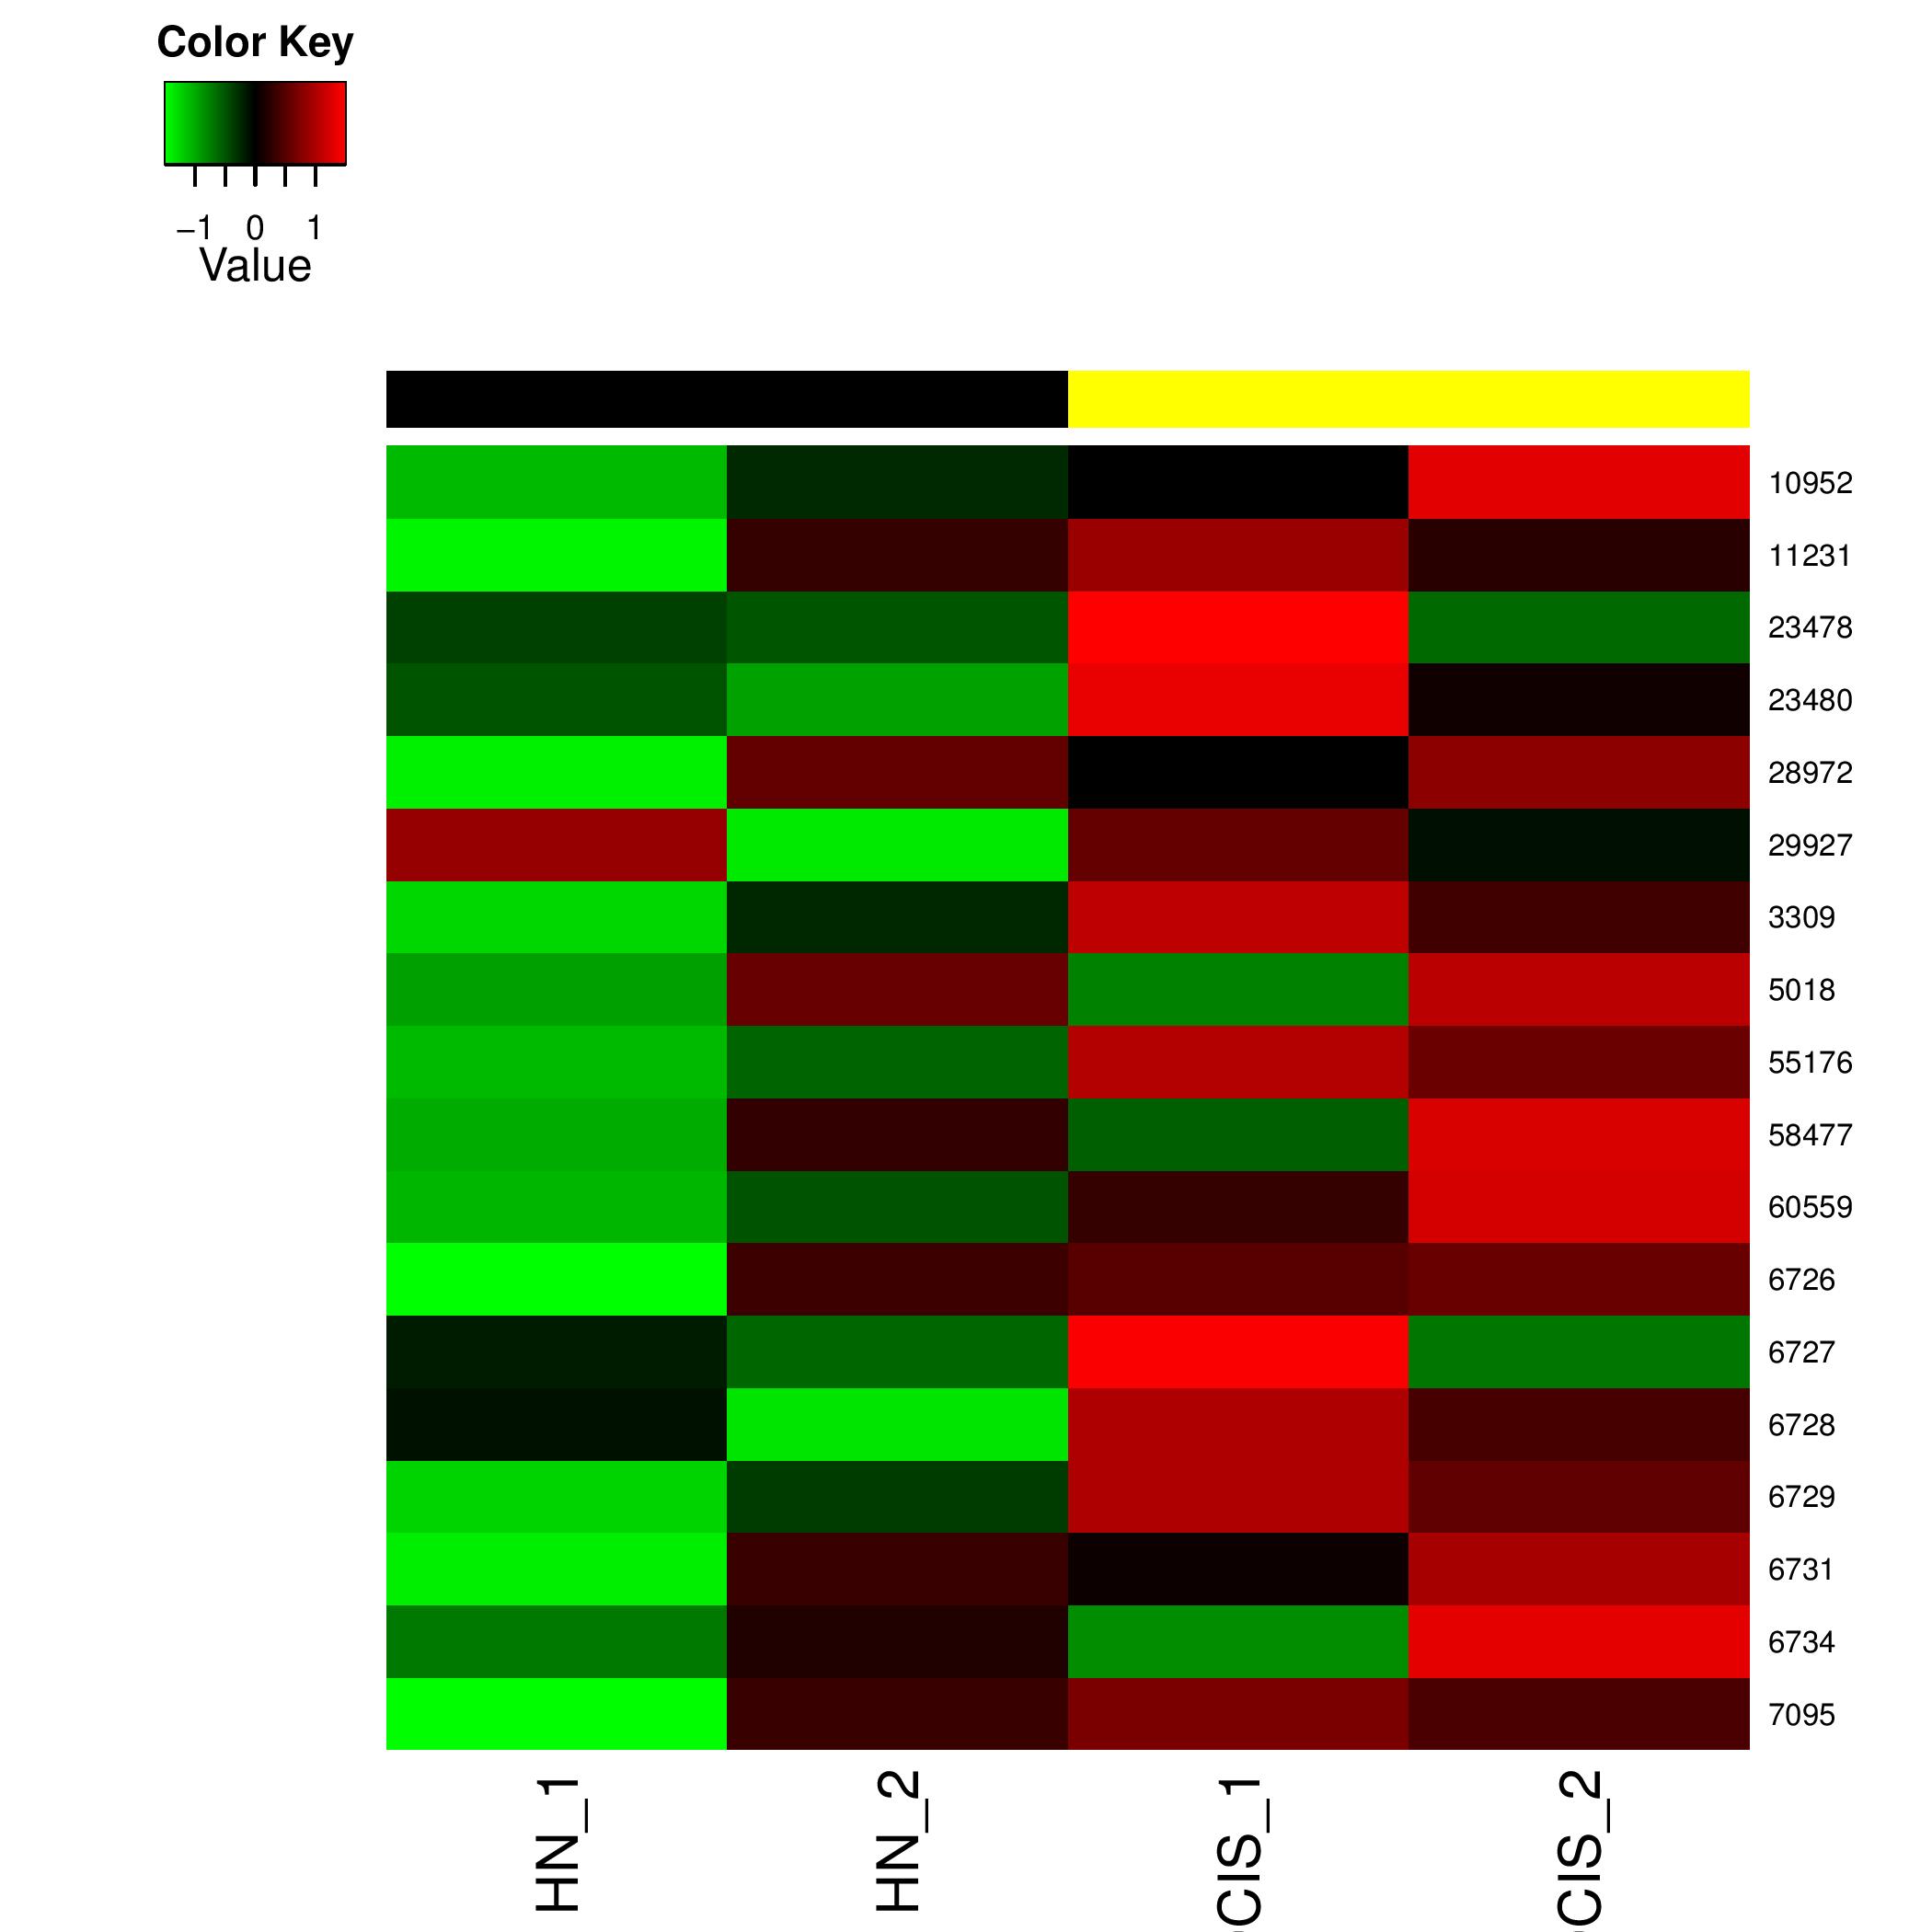
Individual HeatMaps
Heat Map generated for all the significant pathway id's figure shows an example heatmap generated
Typical File Name: hsa03050.geneData.heatmap.pdf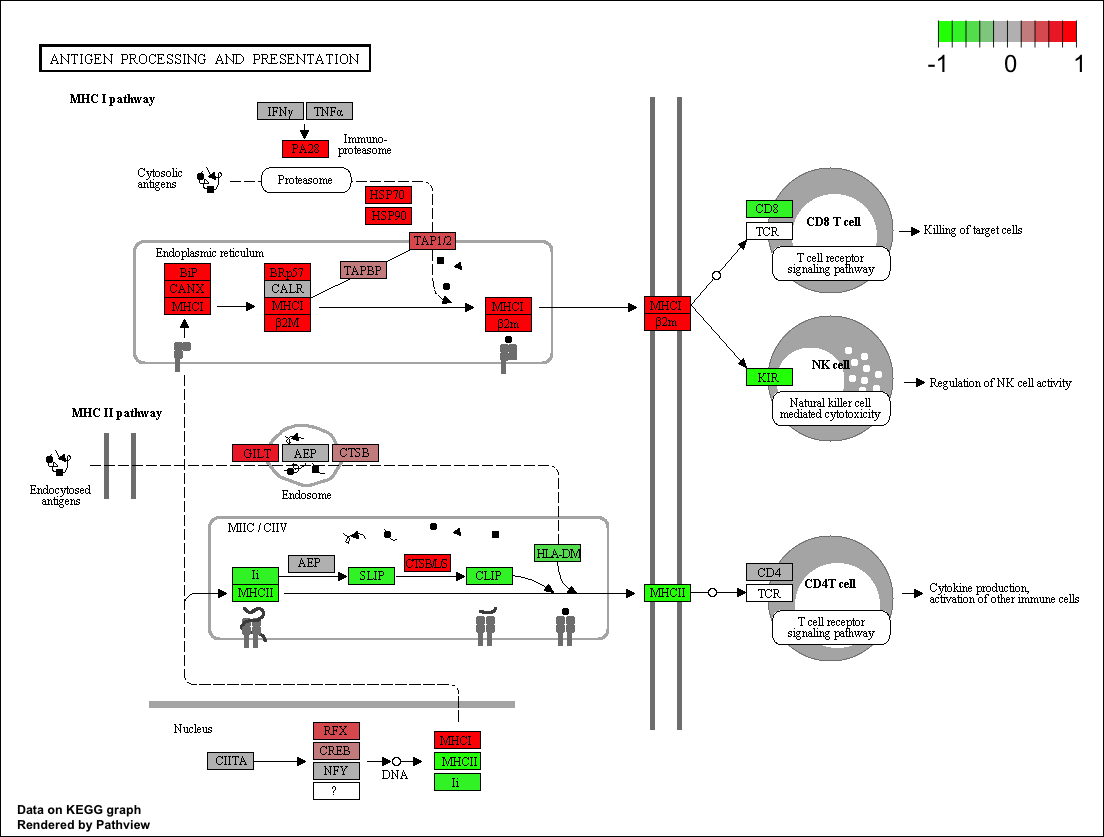
Pathview Graph
If Pathview required option is set then pathviews are generated for all the significant pathway id's figure shows an example heatmap generated
Typical File Name: hsa03050.pathview.multi.png
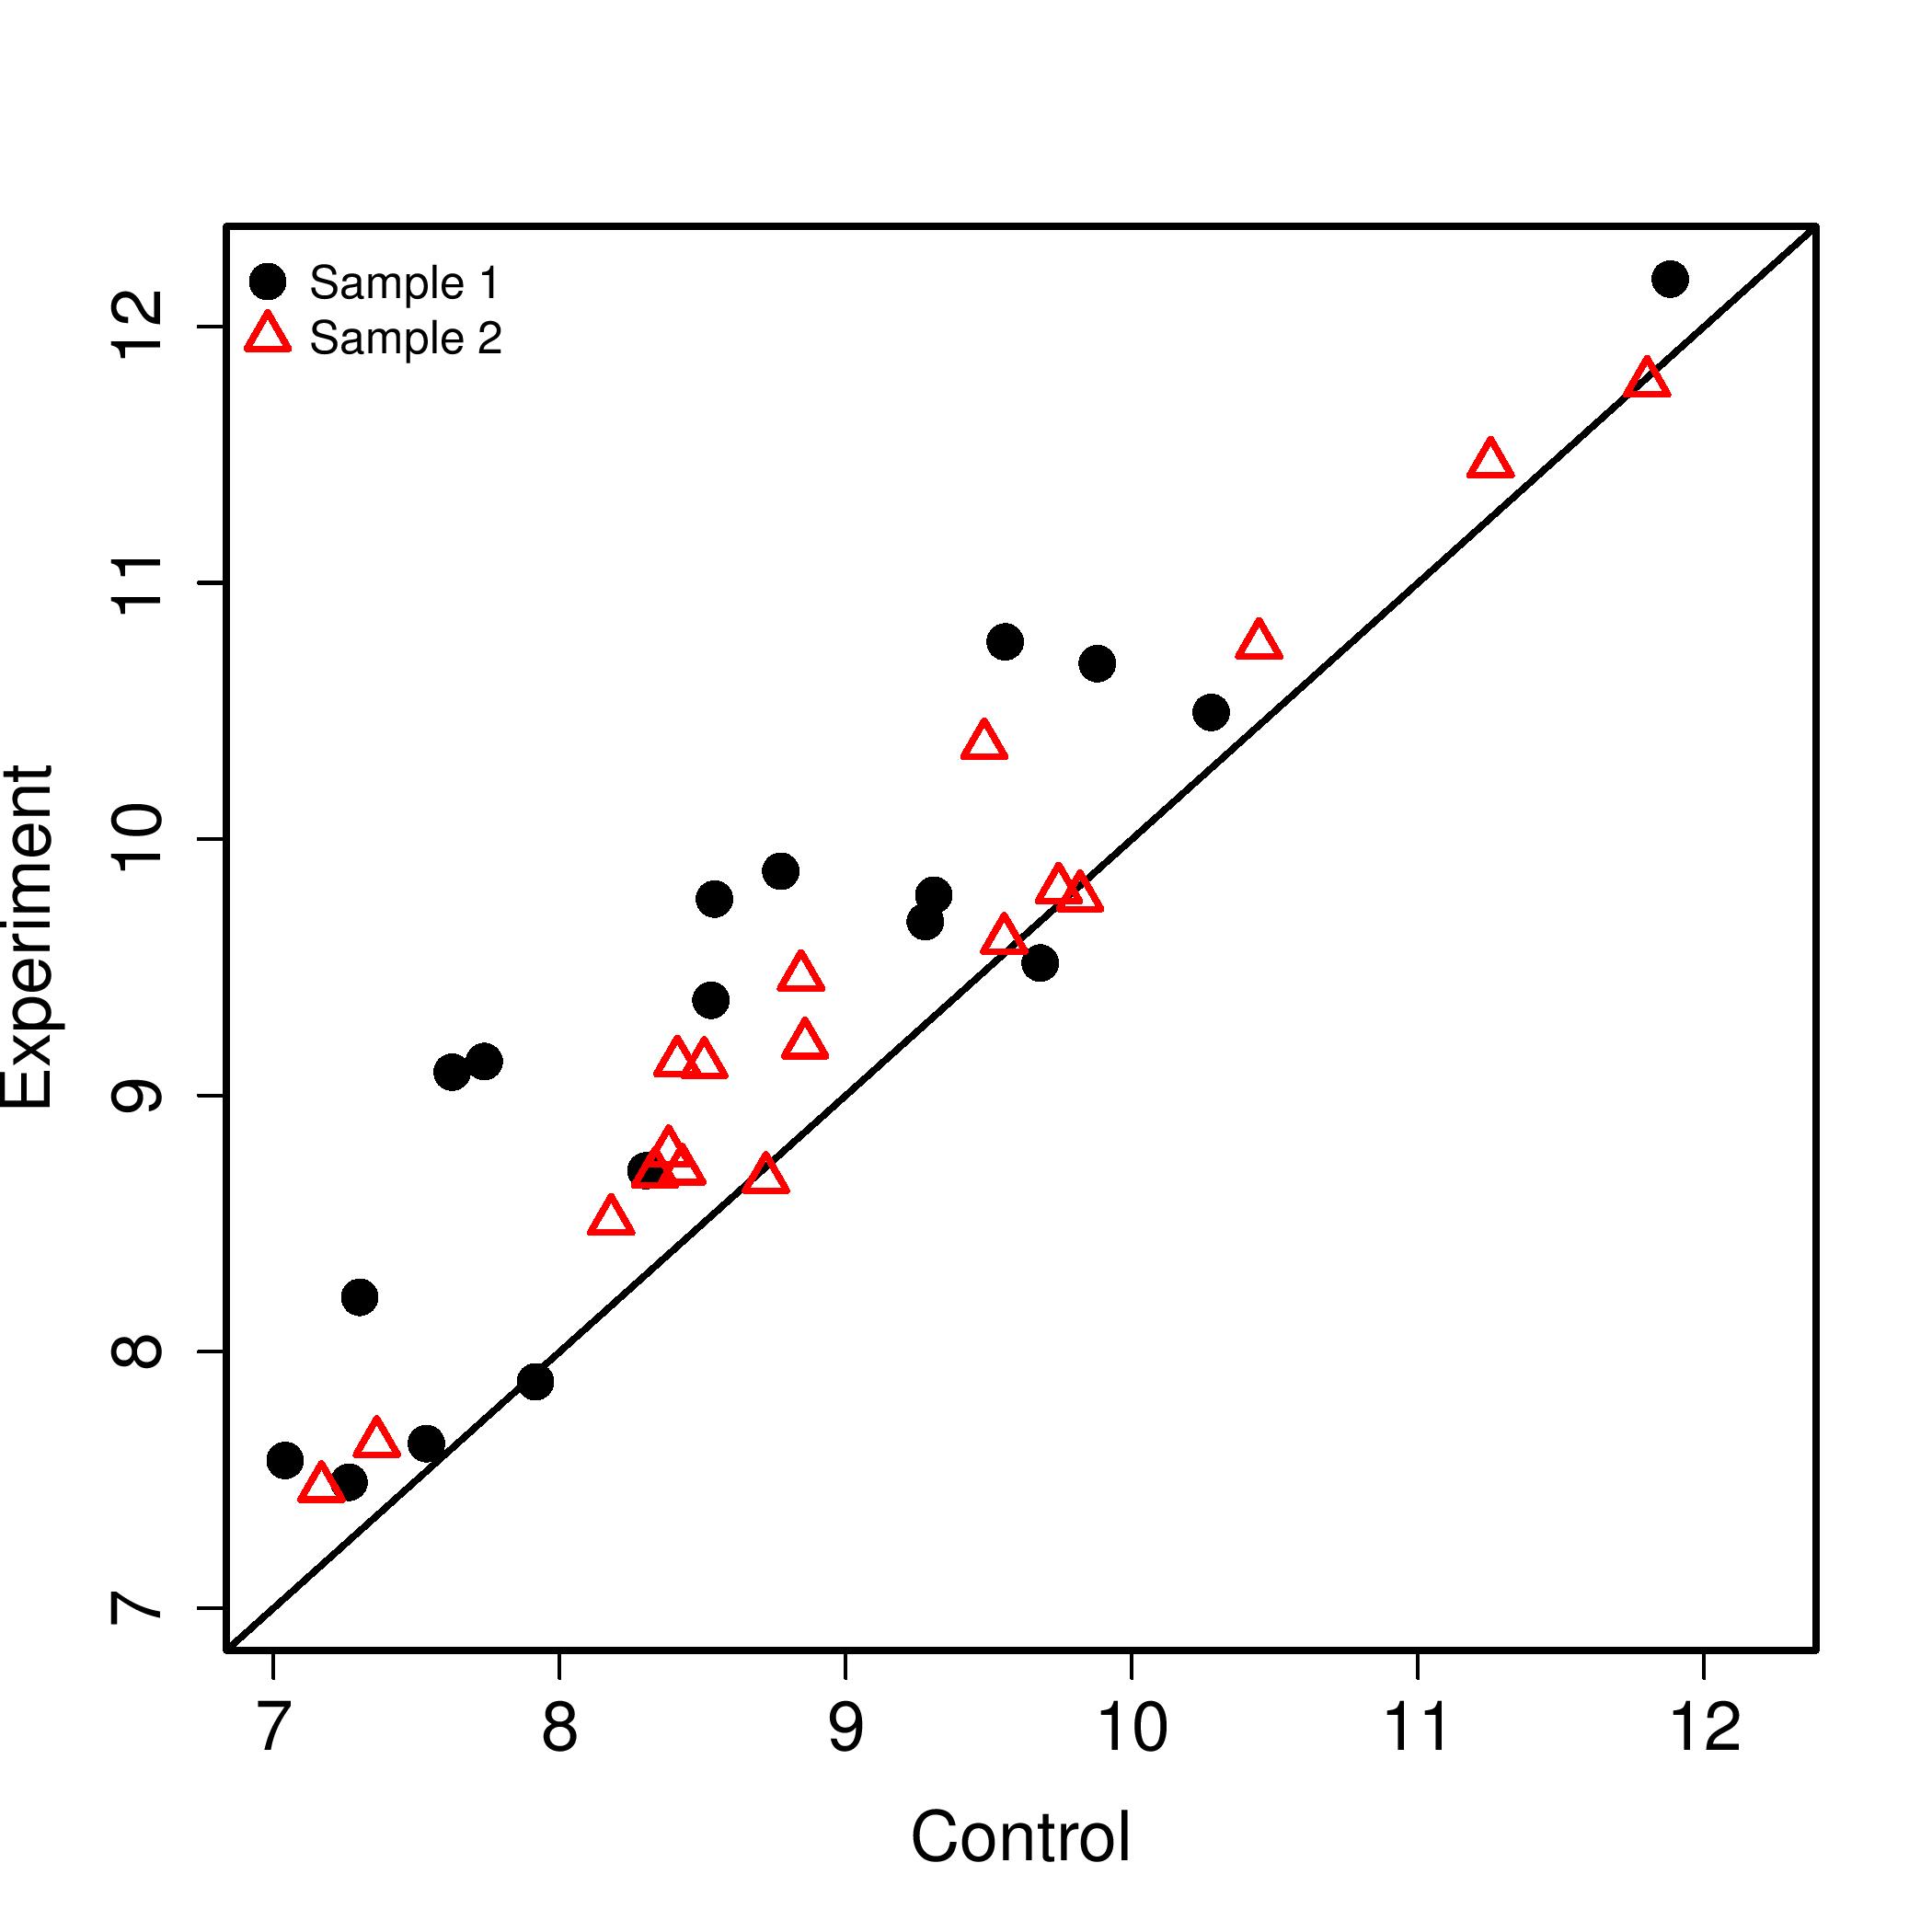
Scatter Plots
Heat Map generated for all the significant pathway id's figure shows an example heatmap generated
Typical File Name: hsa03050.geneData.pdf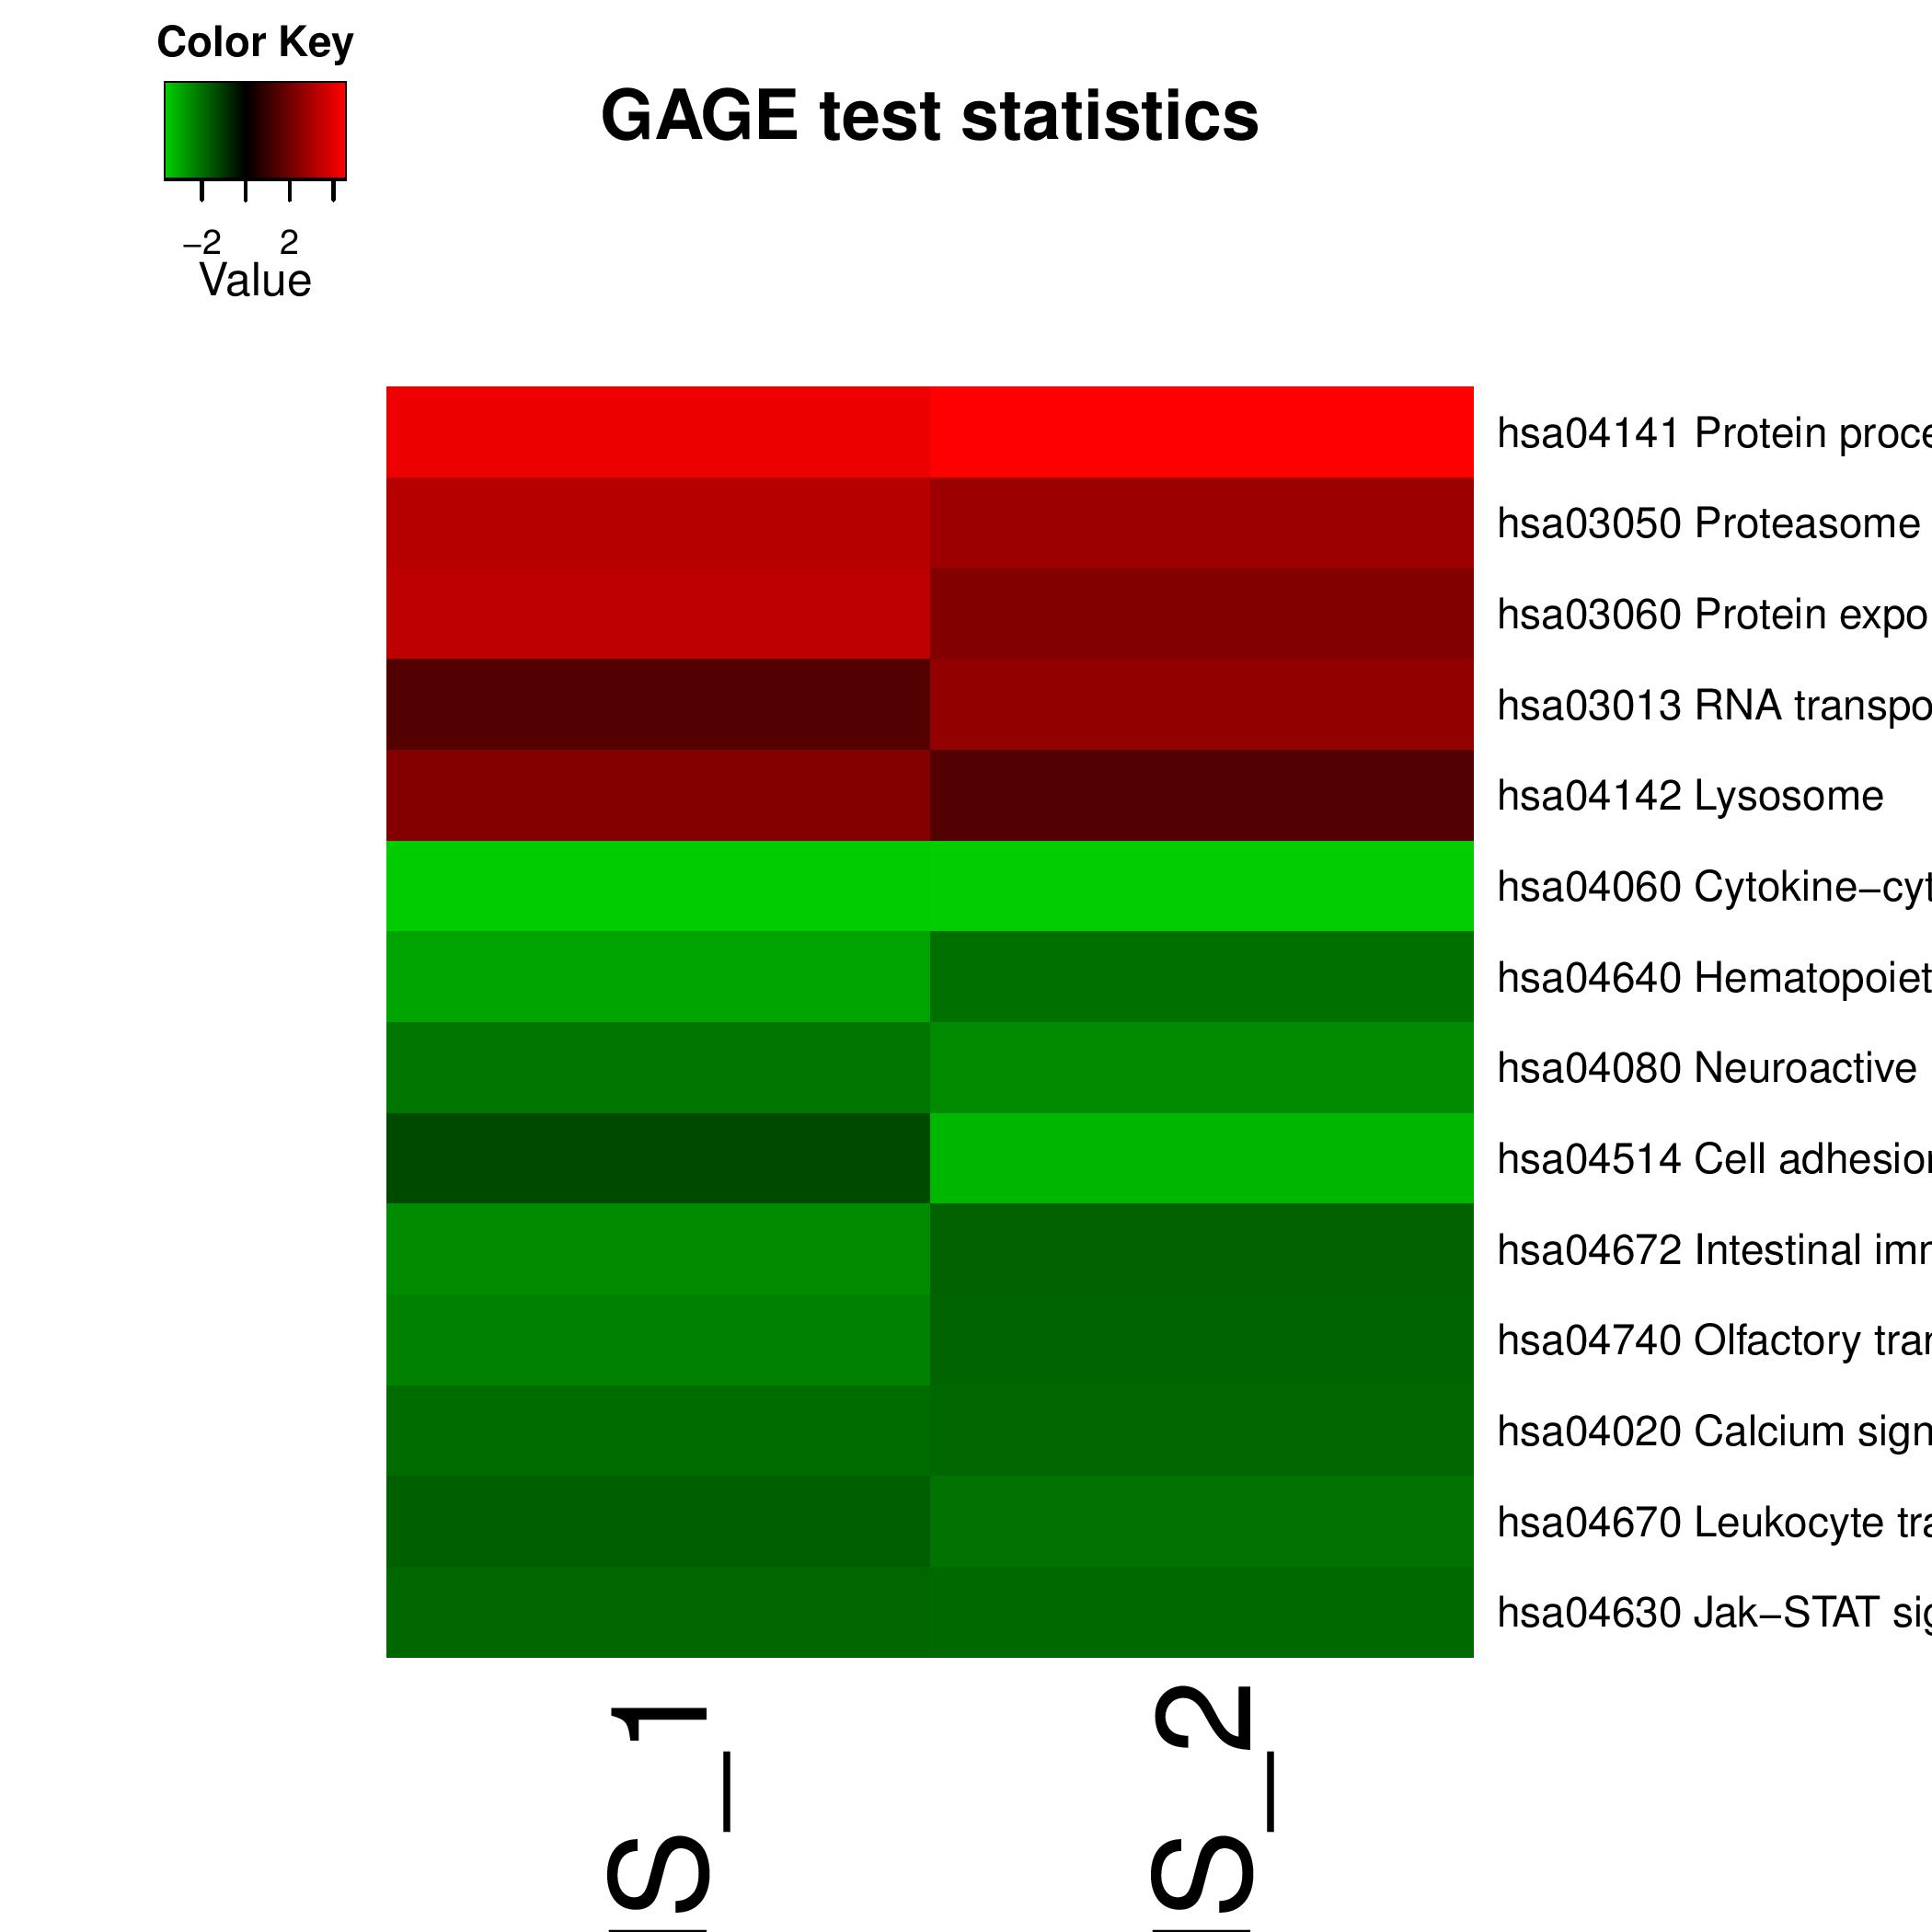
Combined Heatmaps
Output shows the heat map of the entire genesets.
Typical File Name: gage.res.gs.heatmap.pdfArgument List
Output show the list of arguments specified by the user for the anlysis. you can make a note of it and reperform the analysis for better results.
Files Generated
Output shows the list of files generated from the anlysis clicking on the file names you can download/view the file content, below is the sample list.
Input and Output
- Input data containing an expression matrix or matrix-like data structure, with genes as rows and samples as columns. Accepts only CSV and TXT as extension.
- Gene set can be taken from 3 categories kegg, Go and Custom gene set uploaded using a txt or csv file containing the name list each element contains a gene set that is a character vector of gene IDs or symbols
- Sinaling : sig.idx
- Metabolic : met.idx
- Sigmet : sigmet.idx
- disease : dise.idx
- all : c(sigmet.idx,dise.idx)
- BP : GSETS.BP
- CC : GSETS.CC
- MF : GSETS.MF
- all : BP+CC+MF
Kegg
GO
- ID type used for the Gene Data. This can be selected from the drop down list. for GO Gene sets the list is restricted to the Gene ID paired with species and auto changes with species value If you are giving the custom gene set Id's then the values is set to custom.
- Either the KEGG code, scientific name or the common name of the target species.This can be selected from the autosuggest drop down list.
- Column numbers for the reference condition or phenotype i.e. control group if you specify null than all the columns are considered as target experiments.
- Column numbers for the target condition or phenotype i.e. experiment group in the exprs data matrix. if you specify null than all the columns other than ref are considered as target experiments
Analysis
- numeric, q-value cutoff between 0 and 1 for signficant gene sets selection. De- fault to be 0.1.
- Gene set size (number of genes) range to be considered for enrichment test. Tests for too small or too big gene sets are not robust statistically or informative bio- logically.
-
Comparison scheme to be used. List of comparison methods available
- paired: default reference and sample columns should be of equal number of columns
- unpaired: one on one comparison between reference and sample columns
- 1 on Group: one sample column at a time vs the average of the refernce columns
- as group: Used for PAGE-like analysis
- To test for changes changes towards both directions simultaneously. or test a gene set toward a single direction(all genes up or down regulated)
- whether do the optional rank based two-sample t-test (equiv- alent to the non-parametric Wilcoxon Mann-Whitney test) instead of parametric two-sample t-test. This argument should be used with respect to argument Test
- Whether to use fold changes or t-test statistics as per gene statistics.
-
Function used for gene set tests for single array based analysis. Default to be
t-Test, which features a two-sample t-test for differential expression of gene
sets.
Other options includes:
- z-Test: using one-sample z-test as in PAGE
- Kolmogorov–Smirnov test: using the non-parametric Kolmogorov-Smirnov tests as in GSEA
- Argument to perform pathview generation or not.
- Data type Gene,Compound while generating the pathviews. This argument is visible only when use pathview option is made to true.
Example 1: GAGE Analysis for Pathview
Output Plots and heatmap snapshots:
Individual Heat Map
Individual Scatter Plot
Arguments used in example analysis:
- Applied Options
- reference:1,3
- sample:2,4
- filename:
- gene Set Category:kegg
- geneSet:sig.idx
- species:hsa
- cutoff:0.1
- geneIdType:entrez
- setSizeMin:10
- setSizeMax:INF
- compare:paired
- test.2d:False
- rankTest:False
- useFold:True
- test:gs.tTest
- do.pathview:False
Example 2: GAGE Analysis With Custom Gene Set ID's and Gene ID's
Output Plots and heatmap snapshots:
Individual Heat Map

Individual Scatter Plot
Arguments used in example analysis:
- Applied Options
- reference:1,3
- sample:2,4
- filename:
- GeneSet filename:
- gene Set Category:custom
- geneSet:custom
- species:custom
- cutoff:0.1
- geneIdType:custom
- setSizeMin:10
- setSizeMax:INF
- compare:paired
- test.2d:False
- rankTest:False
- useFold:True
- test:gs.tTest
- do.pathview:False